Daily Leverage Certificates
DLC Hotline: (65) 6226 2828
Dollar Index DXY at 4-week high, moving averages indicate bear rally. Gold steps into negative year-to-date. German Dax ends the week with a bearish engulfing candle breaking its upward spell. Dow Jones Industrial average is now in the red year-to-date.
● Hong Kong Monetary Authority says market demand for loans shows improvement.
● China’s equities market officially adopts registration-based IPOs.
● FDI in China rose 10% year-on-year in January 2023 with particular flow into high tech manufacturing.
● au Jibun Japan Manufacturing PMI fell to 47.4 in February 2023. This is the fourth period of contraction.
● Iraq’s central bank allows trade with China to be settled in Yuan.
● HSTech will add Weibo (WB-SW), drop Ming Yuan Cloud from the index from 13 March 2023. HSI will remain unchanged.
Hang Seng Index closed this week at 20010, down 710 points or 3.43%. 20000 was a former support and prominent round number. That the index closed this week just shy of this level could be a nod to this level. Below 20000 the next support could be 19450. This is based on a series of lows observed in August 2022. Between 19450 and 20000 this could form a support zone for intraweek price action. If the index falls further, then 100 and 150 Day SMAs (red and yellow) could play a part. Moving average indicators suggest that the previous downtrend that started in 2021 is over, that the HSI is likely going through a bullish reversal setup. If this indication is true, then look out for a golden cross in the 100 and 150 Day SMAs and then subsequently for the index to form a higher low.
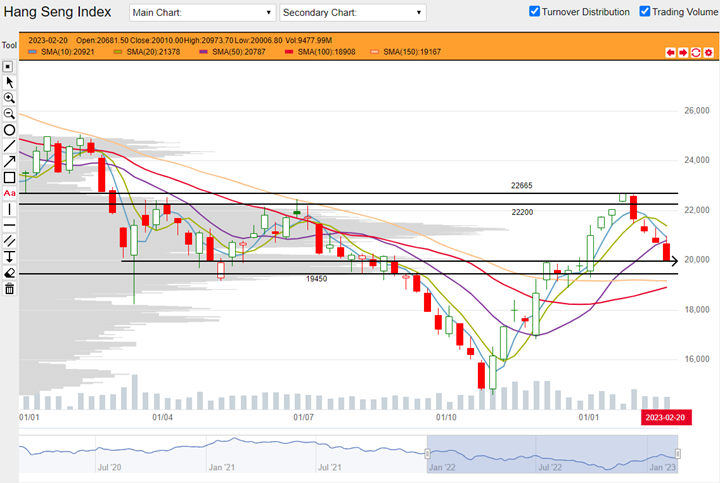
HSI weekly chart from 03 January 2022 to 24 February 2023 (Source: DLC.socgen.com)
Hang Seng Tech closed the week at 4011, down 247 points or 5.8%. 4000 is a previous support so it is possible that HSTech’s descent could slow or stop here. Further below, 3500 is the next possible support to look at. Similarly the 100 and 150 Day SMA (red and yellow) could play a part. Based on moving average indicators, it is likely that HSTech’s previous downtrend is already over but it has to go through a bullish reversal setup before making higher moves.
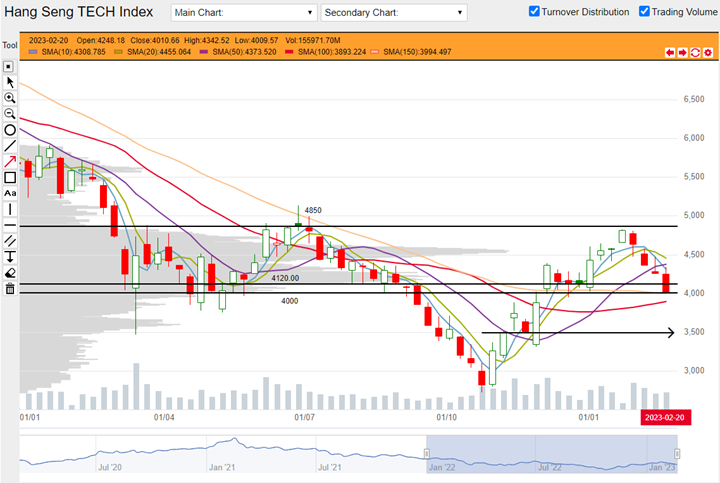
HSTech weekly chart from 03 January 2022 to 24 February 2023 (Source: DLC.socgen.com)
Dow Jones Industrial Average took a turn for the worse, closing at 32817, down 1010 or 2.99%. With this move, the index is now in the red year-to-date. At the moment the index is sitting on support with the 100 and 150 Day SMAs right below. Additionally there is confluence from a previous swing low observed in mid-December 2022 in the weekly chart. Combined together, 32550 to 33000 forms a possible support zone. Nasdaq closed at 11970, down 389 points or 3.14%.
The next FOMC meeting is scheduled on 22 March 2023. Probability of a 50 basis point hike has risen steadily since the last three weeks. The market is betting that interest rates will hit 6% as early as this year’s July Fed meeting.
Fed funds futures on rate hike probability by next Fed meeting as at last DLC commentary on 17 Feb:
● 81.9% probability of 25 basis points rate hike | 18.1% probability of 50 basis points hike
Fed funds futures on rate hike probability by next Fed meeting at this week’s reading:
● 73.0% probability of 25 basis points rate hike | 27.0% probability of 50 basis points hike
Shanghai Composite closed the week at 3267, up 43 points or 1.34%. Shenzhen Index closed at 11787, up 72 points or 0.61%.
Economic data in coming week:
1. Tuesday 28 February 2023, incoming BOJ Governor Ueda will speak.
2. Tuesday 28 February 2023, US reports CB Consumer Confidence.
3. Wednesday 01 March 2023, China reports PMI and HSBC PMI figures.
4. Wednesday 01 March 2023, BOE Gov Bailey to speak.
5. Wednesday 01 March 2023, US reports ISM Manufacturing PMI.
6. Friday 03 March 2023, US reports ISM Services PMI.
Other news:
● Greatwall Motor bought back shares.
● China Mobile made new 52-week high.
● China’s banking and insurance regulator fined China Construction Bank for non-compliance.
● Hino Motors dropped sales of BYD electric bus because BYD planned to apply hexavalent chromium, a carcinogen.
● Kuaishou Technology’s livestreaming real estate arm, Kuaishou Ideal Home,reportedly sold 10 billion yuan worth of properties in 2022
● Xiaomi and China Telecom signed an agreement to deepen cooperation in 5G.
● Media reported that China urged its SOEs to stop using services of Big Four auditors but this was denied by insiders.
● BABA investment income from Ant dived 83% in the last quarter. Chairman and CEO Zhang revealed that BABA will focus on consumption, cloud computing and globalization in the long run.
● Xpeng to be added to Hang Seng China Enterprises Index (HSCEI).
● China’s Civil Aviation Authorities approve Meituan’s logistics UAV for use in urban operations.
Technical observations
Alibaba 9988.hk nearing previous swing low, to look for throwback signal.
Note chart features:
1. Based on previous swing highs, Alibaba's resistance zone falls between $110-121. Based on previous swing low, potential support could be anywhere between $79-86. 100 and 150 Day SMAs (red and yellow) could also play a part as support. Look for price action to confirm.
2. Moving average indicators suggest that the previous downtrend that dominated 2021 could be over. 100 and 150 Day SMAs have not crossed yet but this signal is usually late. Just as pullbacks or bear rallies often occur at the start of the bear trend (see rectangle at top left), throwbacks could be found at the start of a bull trend. Look out for a price action that confirms the current correction as a throwback. Such a signal would be pretty good if it shows up in conjunction with a golden cross in the 100 and 150 moving averages. If price goes to previous low at $60 or makes a new low, there is no throwback. We could instead be looking at a horizontal range or continuation of previous downtrend.
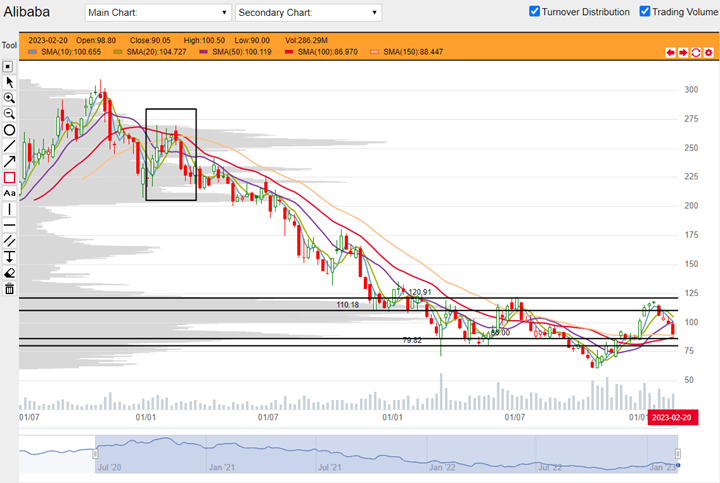
Alibaba 9988.hk weekly chart from 06 July 2020 to 24 February 2023 (Source: DLC.socgen.com)
Anta 20202.hk these features could support a higher low and further gains.
Note chart features:
1. Previous swing highs suggest a potential support of $96-99. Previous swing low suggests another potential support around $82. 100 and 150 Day SMAs (red and yellow) could offer support. Rising lower trendline in the parallel channel could also offer support. Look for price action to confirm.

Anta 2020.hk weekly chart from 04 January 2021 to 24 February 2023 (Source: DLC.socgen.com)
Underlying Index/Stock |
Underlying Chg (%)1 |
Long DLC (Bid Change%2) |
Short DLC (Bid Change%2) |
|---|---|---|---|
| Hang Seng Index (HSI) | -1.87% | CVMW (-7.71%) | WIEW (+11.72%) |
| Hang Seng TECH Index (HSTECH) | -3.26% | ECJW (-8.53%) | Y9GW (+11.30%) |
| Alibaba (9988.HK) | -3.89% | 9O5W (-18.43%) | Z7MW (+21.01%) |
| ANTA Sports Products Ltd (2020.HK) | -3.59% | DBPW (0.00%) |
Brought to you by SG DLC Team
This advertisement has not been reviewed by the Monetary Authority of Singapore. This advertisement is distributed by Société Générale, Singapore Branch. This advertisement does not form part of any offer or invitation to buy or sell any daily leverage certificates (the “DLCs”), and nothing herein should be considered as financial advice or recommendation. The price may rise and fall in value rapidly and holders may lose all of their investment. Any past performance is not indicative of future performance. Investments in DLCs carry significant risks, please see dlc.socgen.com for further information and relevant risks. The DLCs are for specified investment products (SIP) qualified investors only.
Full Disclaimer - here